Every brand of heavy machinery speaks its own data language. Making sense of a whole fleet meant someone spending hours untangling formats before anyone could actually use the information.
Client
A heavy machinery operator running a fleet of equipment from multiple manufacturers, including John Deere, Caterpillar, and Komatsu, each transmitting performance data in its own format.
Challenge
Different equipment brands send performance data in different, incompatible formats, so getting a clear, combined view of the whole fleet took significant manual effort just to prepare the data before anyone could analyze it. The client needed a way to see performance across their entire fleet, regardless of brand, without that bottleneck.
Solution
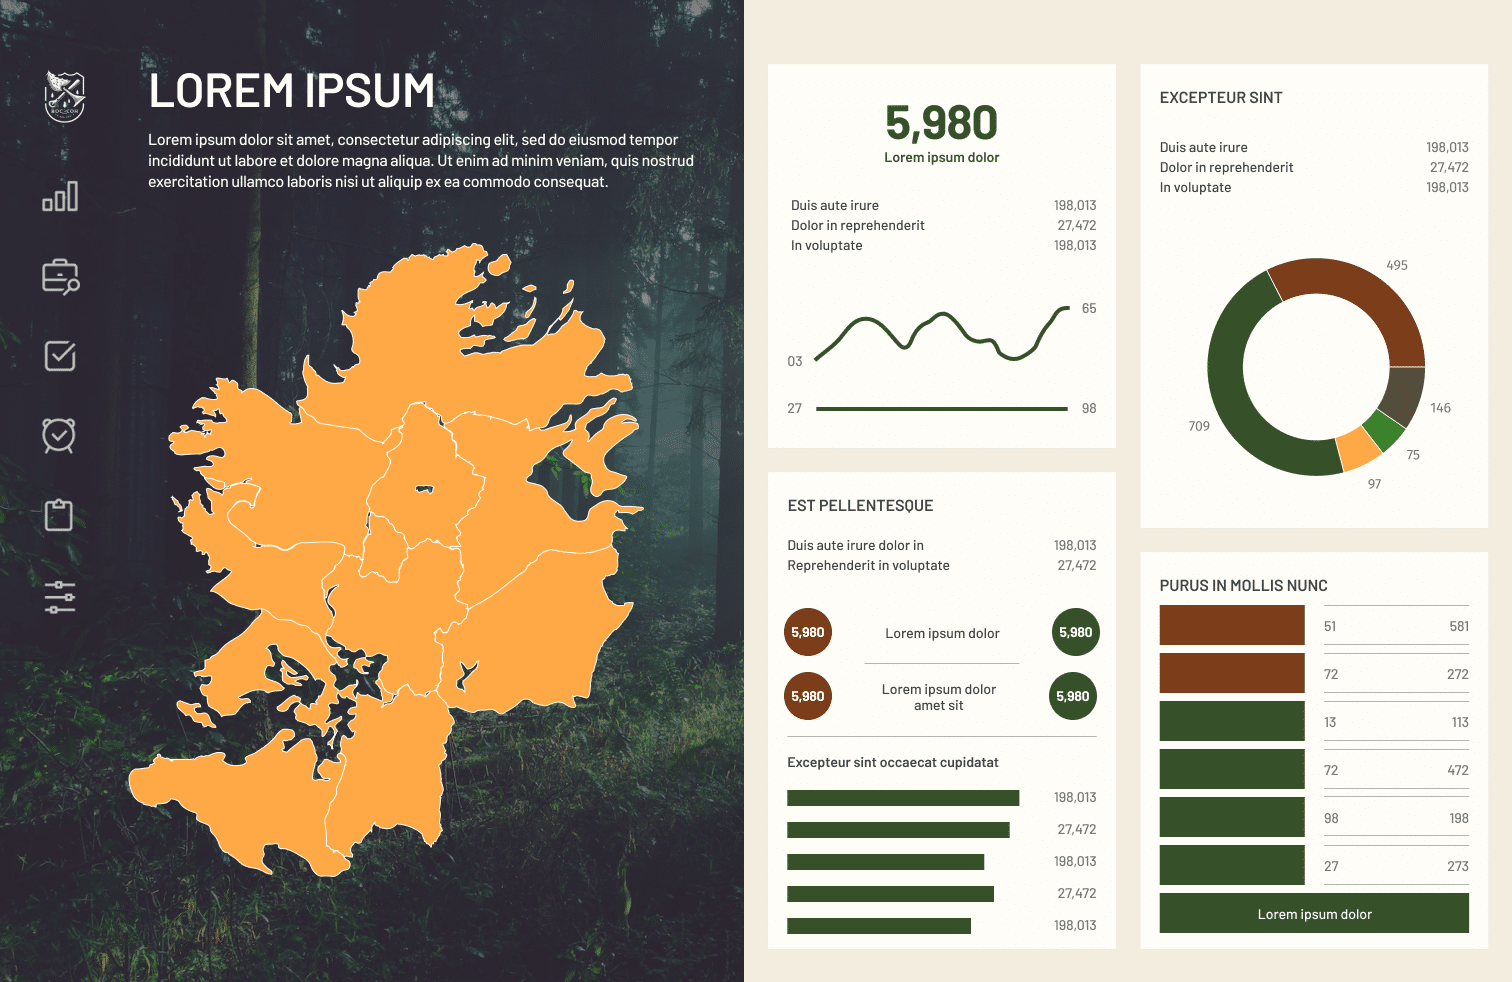
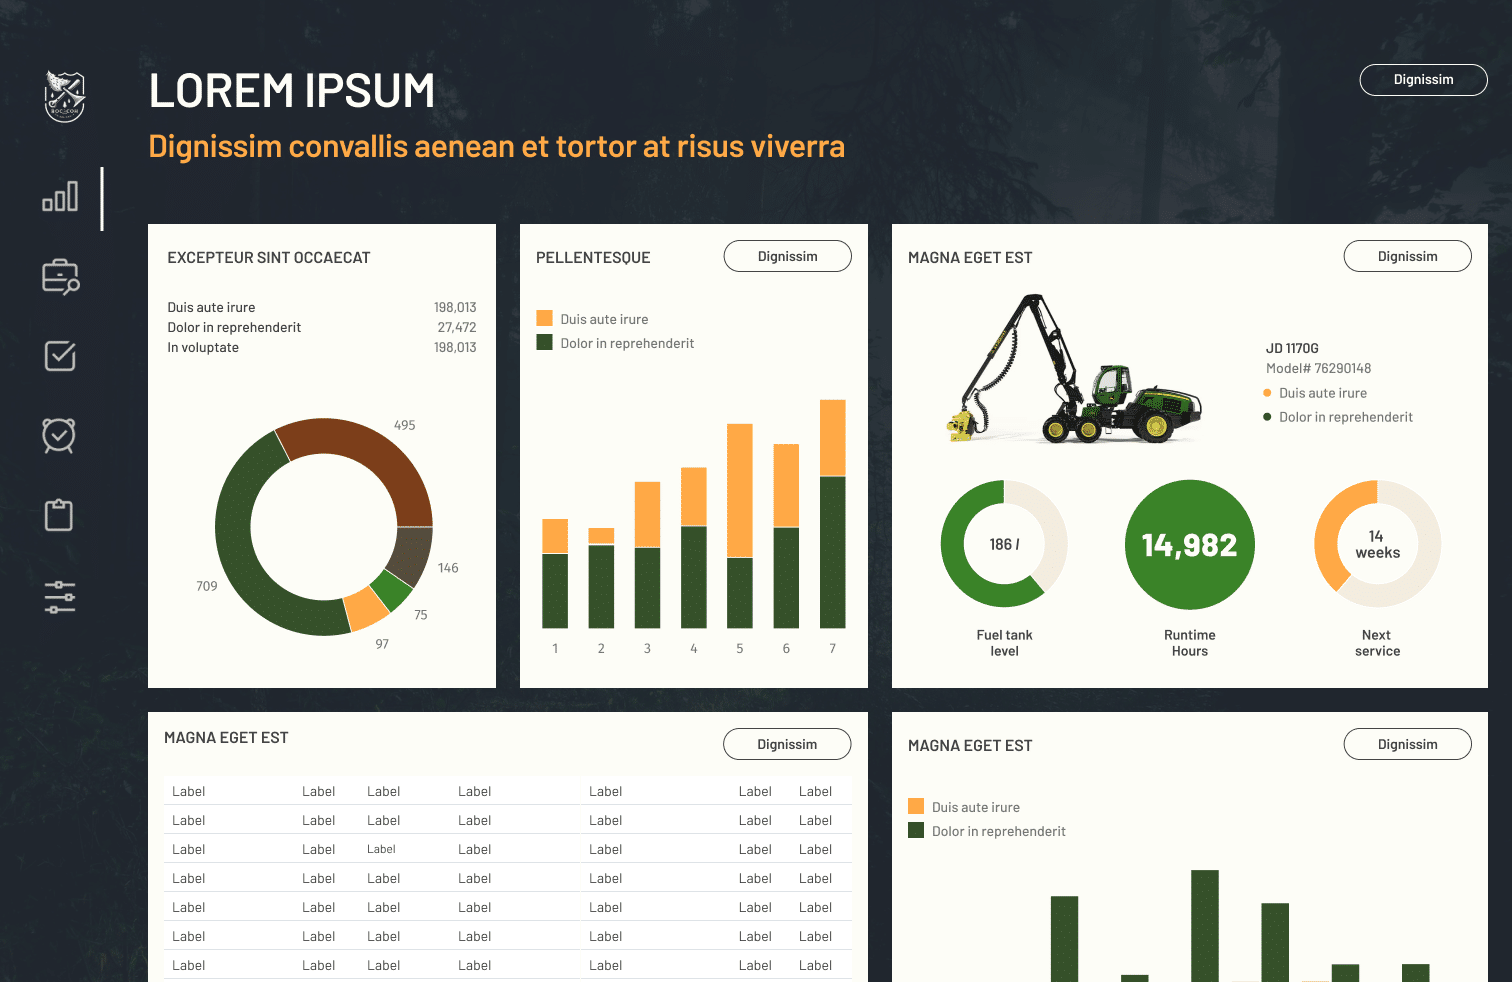
We built a centralized dashboard that pulls in data from every equipment brand, converts it into one consistent format, and turns it into visualizations anyone on the team can use, on a phone, tablet, or desktop. We started by running workshops with the client’s own teams, including relevant regulatory stakeholders, to understand how they actually worked, then tested an early version with real project managers and analysts before rolling it out gradually, starting with a small team and expanding once it proved its value.
Results
One View of Every Machine, Regardless of Brand.
Project managers can now see fleet performance by machine, region, or time period from a single dashboard, letting them plan refueling and maintenance ahead of time instead of reacting to problems as they come up.
Technical Details
Built using React Native and Next.js with a non-relational database, developed through service design workshops, design sprints, and an incremental MVP rollout, expanding from a small pilot team to broader use across the organization.
Managing a Fleet of Equipment From Different Manufacturers?
If pulling together data from multiple equipment brands is eating up your team’s time, we can help you build one dashboard that makes sense of all of it.
Skills
Primary & secondary research
Workshop facilitation
UX/UI design
Prototyping
Frontend development
Backend development
Frameworks
Design thinking
Business model canvas
Value prop canvas
Lean startup
Scrum
Technologies
React Native
Next JS
Non-relational DB
CSS, HTML
Tools
Figma
Miro
Visual Studio Code
IntelliJ IDEA
Github
How we did it
At A-CX, we deliver value to our clients. Before taking on any project, we thoroughly analyze the business and its challenges. This is to ensure we can make a meaningful impact. We only ever engage if we are confident that we can meet our client’s specific needs and goals.
Service Design
To provide the best possible service, our Service Design team gains a thorough understanding of the four crucial components of the organization: People, Processes, Products, and Partners. Our team engaged in workshops with representatives from various teams in the organization, actively listening and posing strategic questions. We also involved relevant stakeholders in these workshops. Sometimes, this even included representatives from the Ministry of Forests, who ensured that our early ideas were aligned with their specific requirements.
Design Sprints
After thoroughly understanding the organization through our Service Design process, we embarked on a collaborative innovation phase known as a Design Sprint. Our team of software engineers, designers, and project coordinators, collaborated with members of our client’s organization to identify pressing challenges and rapidly ideate, prototype, and test the most promising solutions. This approach leveraged the expertise of our client’s industry and our experience in parallel industries, creating a shared ownership of the final solution, and setting the path for ensuring success.
Creating an MVP
Once we had ideated and prototyped our data visualization dashboard, we conducted user testing to validate, refine and improve our concept. We presented the fleet management dashboard to our target users: project managers, coordinators, analysts, etc. Their feedback was integral in shaping the solution through a process of iteration until it was ready for implementation as a pilot MVP. The goal of this pilot was to observe and measure the team’s performance with the new solution and compare the results to their performance before implementation to assess the solution’s impact.
Incremental rollout
Implementation began with a small team. We continuously gathered feedback and analyzed performance metrics to determine the potential for further enhancements. With successful results, the solution was iterated and improved. When we were satisfied, we socialized the MVP to additional teams within the organization. The goal was for it to become an integral part of their overall workflow. This led to a more intelligent and efficient way of working. It also allowed the organization to make data-driven decisions based on accurate insights and forecasting. By fully embracing digital transformation, our client allowed themselves to step into the future, and stay ahead of the competition.
Discuss Your Project
Great things happen when good people connect. Leave us your details, and we’ll get back to you.
By sending the information in this form, you agree to have your personal data processed according to A-CX’s Privacy Policy and Cookie Policy to handle the request and respond to it.
Related Case Studies

Show Up Online: An Agentic Website Business
Creating a website for a small local contractor costs more than the website is worth, which is why so many of them still do not have one. Closing that gap took AI website generation built into an outreach and delivery engine where the only thing that grows with volume is…

Apple Vision Pro: A Virtual Theater
A-CX partnered with Scene Partners to build StagePlay, an Apple Vision Pro app that puts audiences inside a virtual theater for live and recorded performances. Delivered end-to-end on a fixed schedule, the app debuted with Blue Man Group in December 2025 as the first virtual reality theater experience of its…

Google: Bringing Spatial Audio to REAPER and Adobe Premiere Pro
A‑CX partnered with Google to extend Eclipsa Audio’s reach by enabling spatial audio plugins on REAPER and Adobe Premiere Pro. We ported the original AAX plugin to VST3 and AU using JUCE, resolved complex multichannel routing and export timing issues, and stabilized IAMF workflows. Alongside the technical work, we automated…