Step into the future of forestry with our cross-platform enterprise fleet management solution. Enhance your current operations, predict future output, and extend your competitive advantage.
The challenge
Today’s forestry industry is worth trillions of dollars. Like many other industries, it relies on telemetry data from its fleet to monitor performance and efficiency, and make data-informed predictions. Most companies utilize a multitude of brands in the field like John Deere, Caterpillar, TimberPro, Komatsu, Hitachi, and Ponsse. Each specialist machine has the ability to transmit telemetry data to the cloud.
The challenge is that different brands of machines transmit differently formatted telemetry data, leading to a significant amount of time and resources to aggregate, normalize, and visualize the data into a meaningful representation that can provide an overview of the project.
In today’s rapidly evolving business landscape, embracing intelligent automation is no longer a convenient option. It’s a necessity for staying relevant and competitive. By streamlining operations, your organization has the opportunity to accelerate growth and improve profitability, and sustain your competitive edge.
Our solution
The enterprise fleet management platform
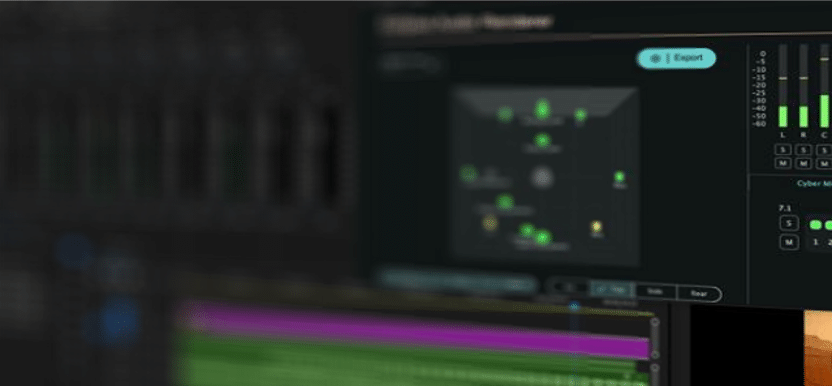
We built a centralized fleet management platform that receives telemetry data from multiple brands of machines, normalizes it, and then presents the information as data visualizations. This allowed project managers, project coordinators, data analysts, etc., to access the data efficiently from any device (phone/tablet/desktop computer), freeing up the bulk of their time and resources to perform the actual analysis and planning.
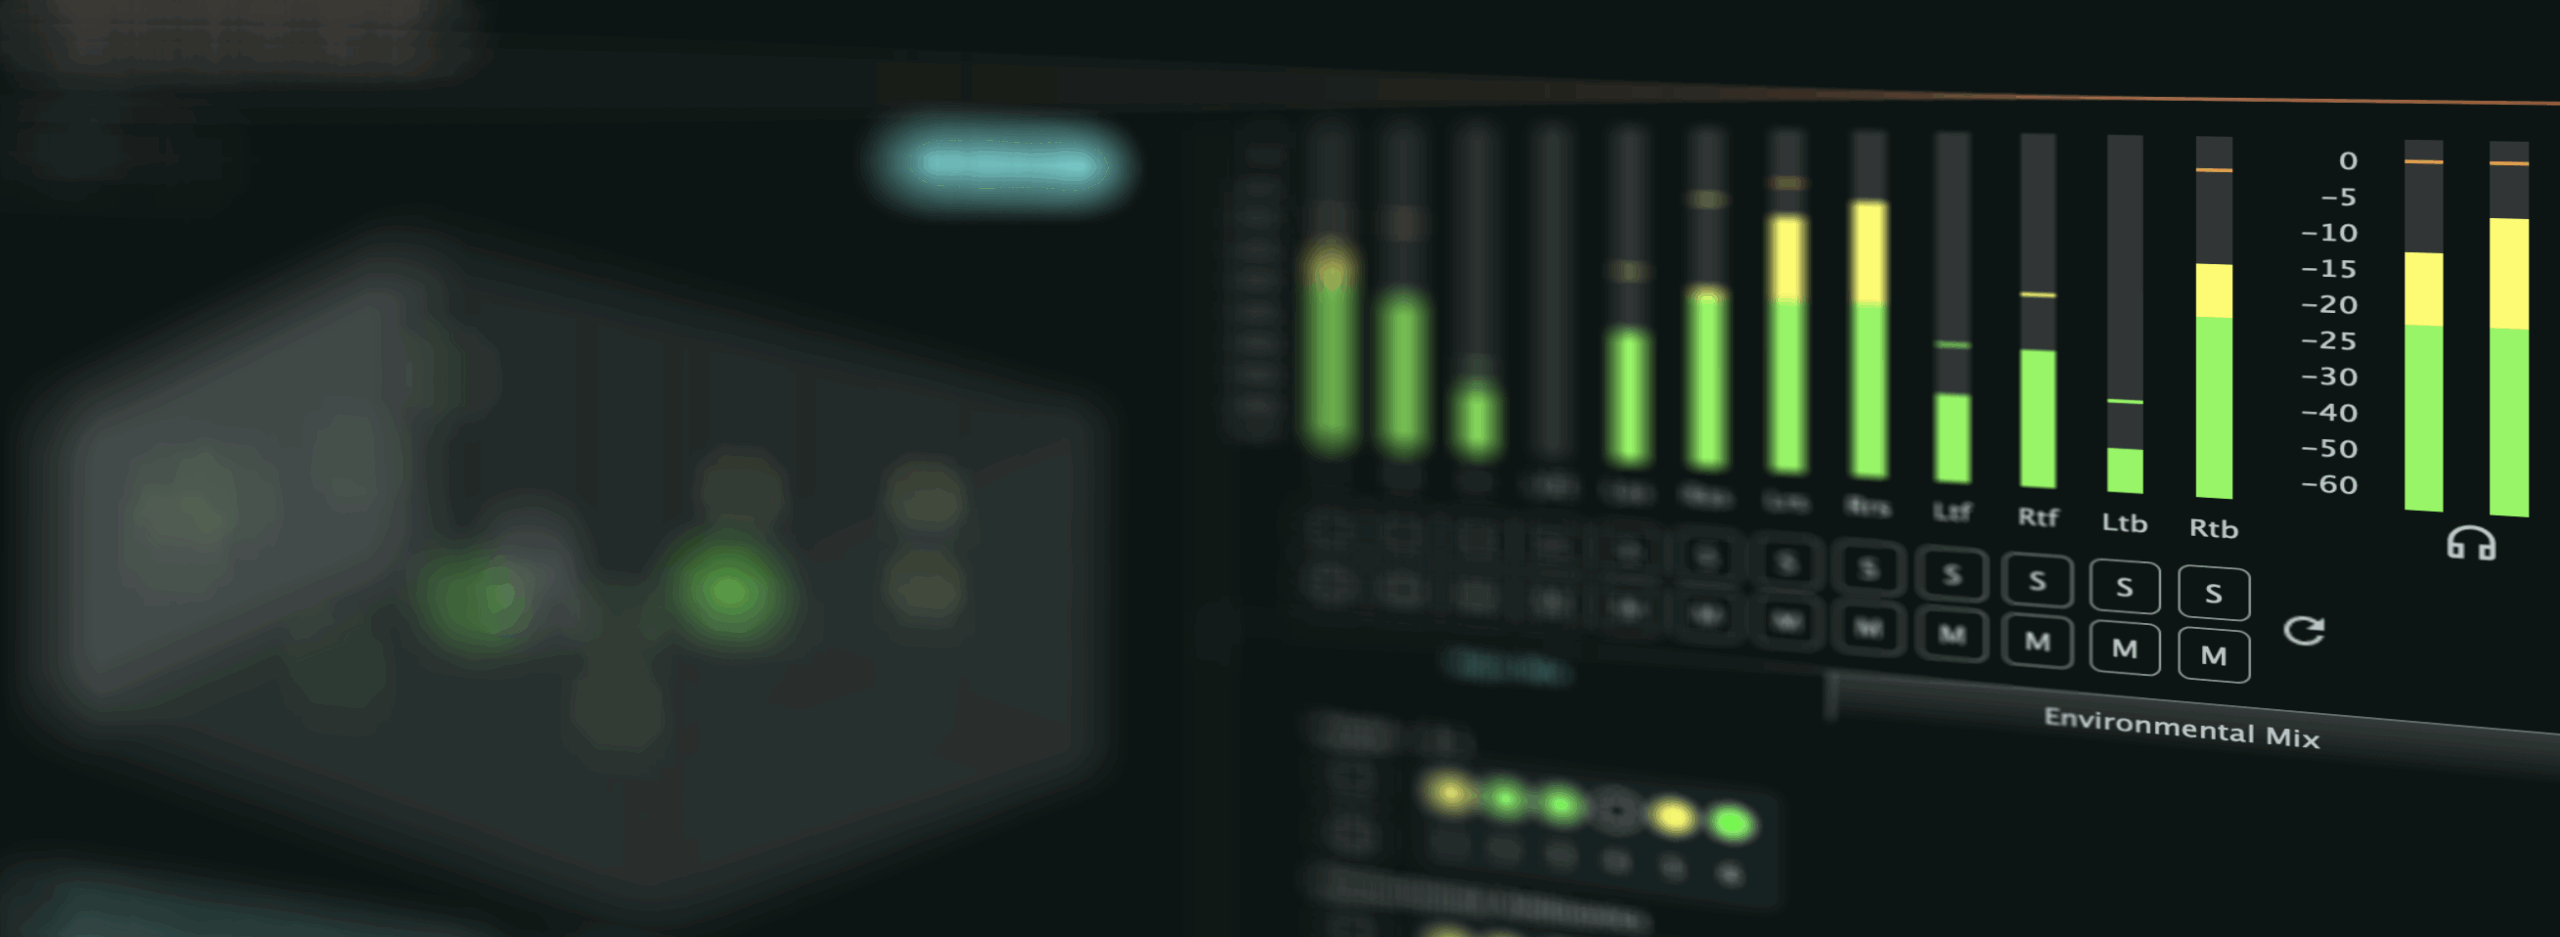
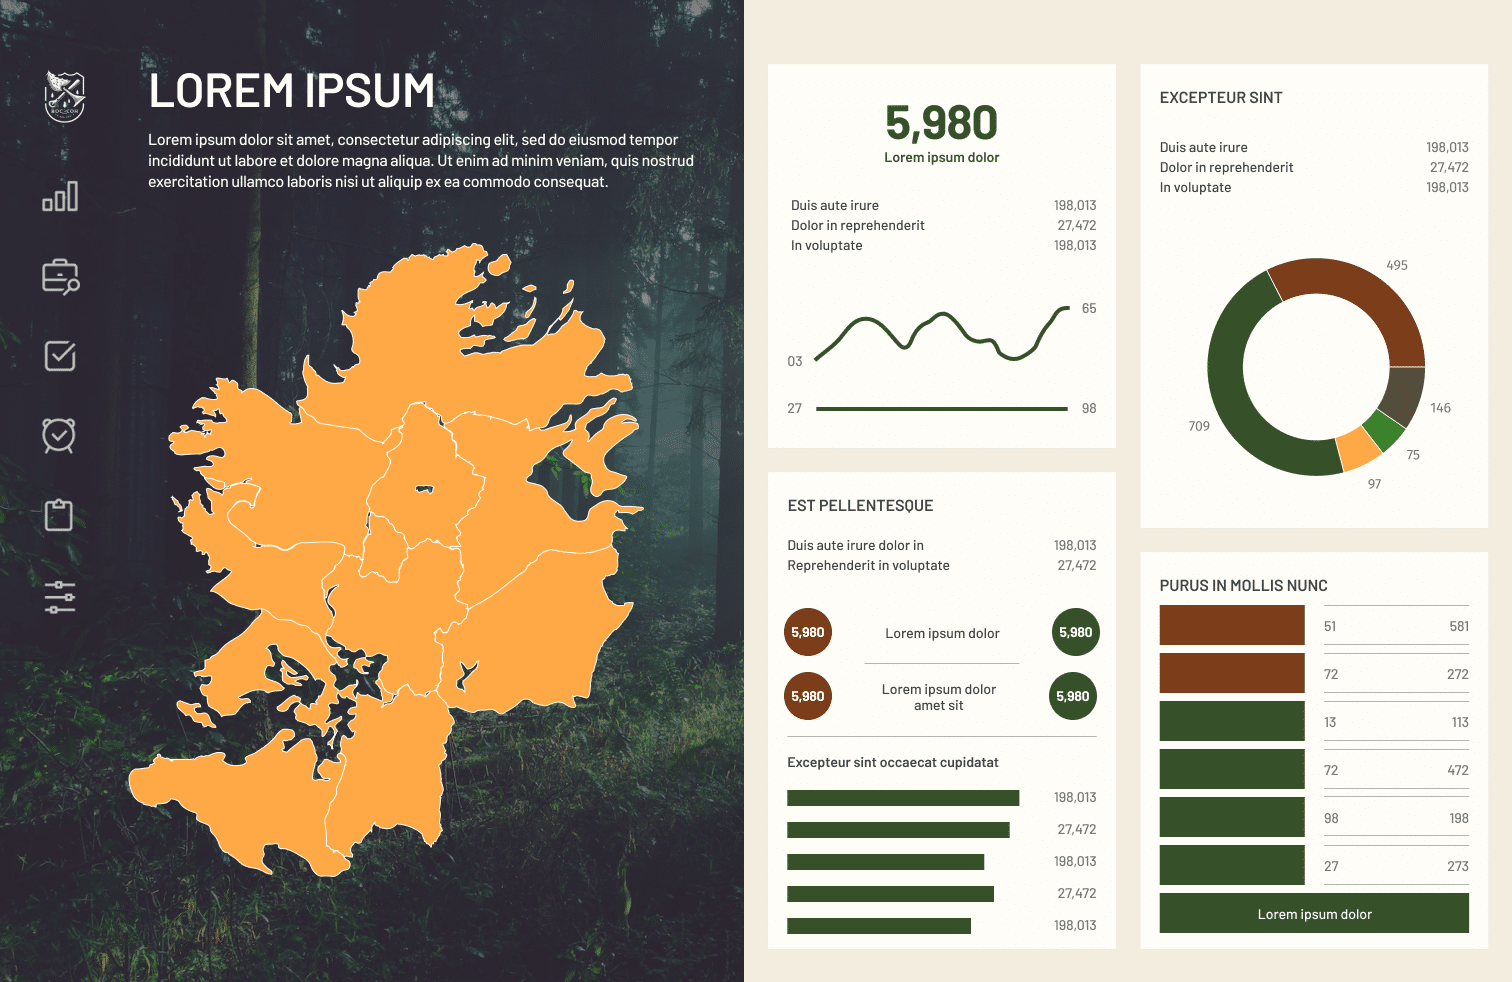
Infographics
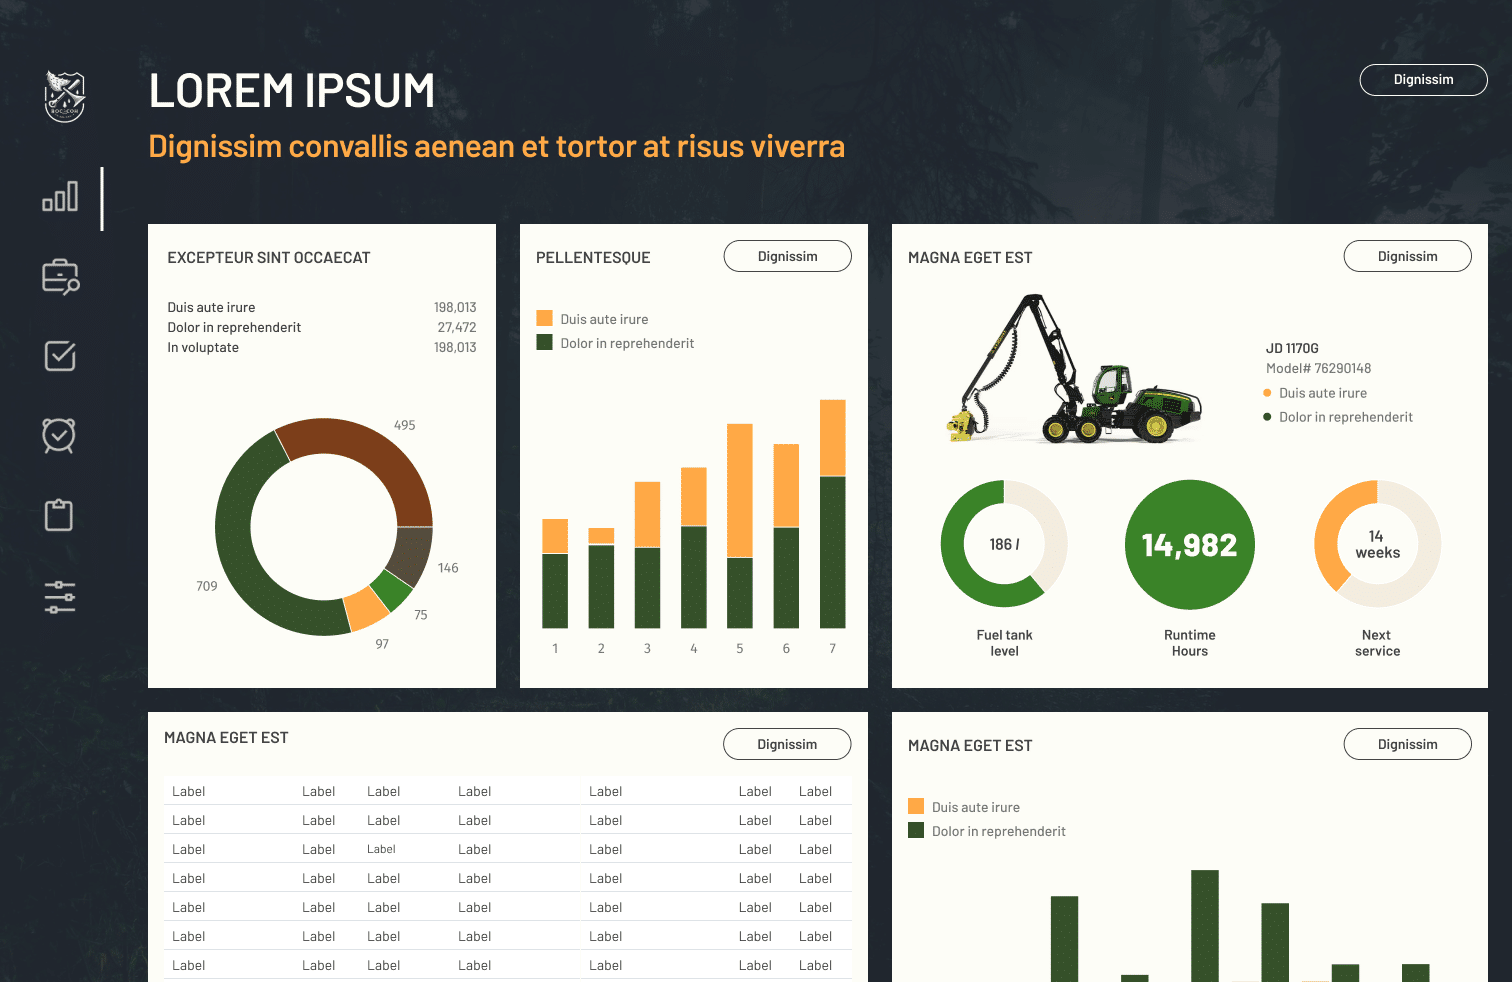
Data visualizations were the primary method for delivering information – by request. We held customer feedback sessions with the end-users to listen to their needs and requests and understand how these features would benefit them. In the end, our dashboard gave the user the ability to zero-in on one machine, a subset of machines, or view the entire fleet. Users can view performance over a day, week, month, or a custom date range. They can look at performance by region, or compare performance between multiple regions over the same date.
Real-time analysis
Project managers can now instantly assess the number of machines that need to be refueled, and order the truck to be on-site at the right time, minimizing downtime. Maintenance intervals can be scheduled well in advance, giving the PM the ability to reorganize tasks to accommodate.
Skills
Primary & secondary research
Workshop facilitation
UX/UI design
Prototyping
Frontend development
Backend development
Frameworks
Design thinking
Business model canvas
Value prop canvas
Lean startup
Scrum
Technologies
React Native
Next JS
Non-relational DB
CSS, HTML
Tools
Figma
Miro
Visual Studio Code
IntelliJ IDEA
Github
How we did it
At A-CX, we deliver value to our clients. Before taking on any project, we thoroughly analyze the business and its challenges. This is to ensure we can make a meaningful impact. We only ever engage if we are confident that we can meet our client’s specific needs and goals.
Service Design
To provide the best possible service, our Service Design team gains a thorough understanding of the four crucial components of the organization: People, Processes, Products, and Partners. Our team engaged in workshops with representatives from various teams in the organization, actively listening and posing strategic questions. We also involved relevant stakeholders in these workshops. Sometimes, this even included representatives from the Ministry of Forests, who ensured that our early ideas were aligned with their specific requirements.
Design Sprints
After thoroughly understanding the organization through our Service Design process, we embarked on a collaborative innovation phase known as a Design Sprint. Our team of software engineers, designers, and project coordinators, collaborated with members of our client’s organization to identify pressing challenges and rapidly ideate, prototype, and test the most promising solutions. This approach leveraged the expertise of our client’s industry and our experience in parallel industries, creating a shared ownership of the final solution, and setting the path for ensuring success.
Creating an MVP
Once we had ideated and prototyped our data visualization dashboard, we conducted user testing to validate, refine and improve our concept. We presented the fleet management dashboard to our target users: project managers, coordinators, analysts, etc. Their feedback was integral in shaping the solution through a process of iteration until it was ready for implementation as a pilot MVP. The goal of this pilot was to observe and measure the team’s performance with the new solution and compare the results to their performance before implementation to assess the solution’s impact.
Incremental rollout
Implementation began with a small team. We continuously gathered feedback and analyzed performance metrics to determine the potential for further enhancements. With successful results, the solution was iterated and improved. When we were satisfied, we socialized the MVP to additional teams within the organization. The goal was for it to become an integral part of their overall workflow. This led to a more intelligent and efficient way of working. It also allowed the organization to make data-driven decisions based on accurate insights and forecasting. By fully embracing digital transformation, our client allowed themselves to step into the future, and stay ahead of the competition.
Discuss Your Project
Great things happen when good people connect. Leave us your details, and we’ll get back to you.
By sending the information in this form, you agree to have your personal data processed according to A-CX’s Privacy Policy and Cookie Policy to handle the request and respond to it.